An Excel function to calculate your dog’s or cat’s age

An Excel function to calculate your dog’s or cat’s age

400 level, Excel
[wp_ad_camp_1] [wp_ad_camp_4] Dog years, explained Do you think one person year equals seven dog years. I did, until doing some research. I wanted to add a “fun” conversion factor for a conversion function in an Excel add-in I've created. What I learned is that the seven year equivalent value is a pretty poor approximation of a dog’s equivalent age. Dogs do mature more quickly than people, but when they are young they mature at an even faster rate (relative to people) than they do when they are older. This post describes some capability you only get by installing an add-in for Excel. The add-in used here is fully functional and free during its trial period - so you'd have plenty of time to try this out. The add-in is called PowerUps…
Read More
How to turn on the Developer tab in Excel

How to turn on the Developer tab in Excel

100 level, Excel
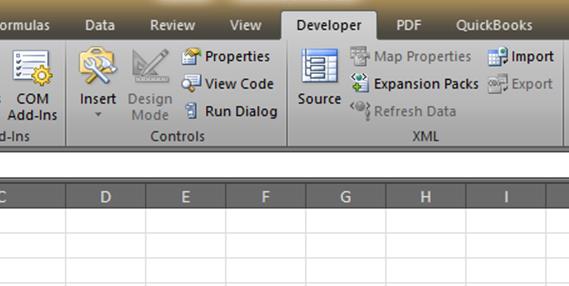
By now I'm guessing you've read some instructions that have asked you to click the Developer tab in Excel. But, you don't see it right? You need to turn on the Developer tab in Excel. Here are the few simple steps to enable the tab. There are steps for both Excel 2007 and 2010. Microsoft moved the option around a bit between versions. Steps to turn on the developer tab in Excel 2007 Click the Office Start button, then click Excel Options. Click on the Popular section in the left navigation, and then click the checkbox for Show Developer tab in the Ribbon. Click OK. The above will show the developer tab in Excel 2007 for you. Steps to turn on the developer tab in Excel 2010 Click File, then…
Read More

How you can use the Histogram tool in Excel

400 level, Excel
[wp_ad_camp_1] [wp_ad_camp_4] First off, what's a histogram? A histogram is just a chart that shows counts of items in discrete buckets. In other words, a bar chart. The histogram tool in Excel lets you define the groupings or buckets. Or, in the terms of the histogram you get to define the Bins. A standard bar chart in Excel will just chart the individual distinct values, which is often not what you need to do. Using the histogram tool you can have Excel automatically count the items in the various Bins you define, and then chart those. Note: You may have also heard of a Pareto chart. That's just a histogram sorted from highest count to lowest. Here's an illustration to highlight the difference Imagine you're a teacher and you need…
Read More

How to find values in one set that are duplicated in another set in Excel

300 level, Excel
[wp_ad_camp_1] [wp_ad_camp_4] Ok, you have a set of values in a column or a row and you want to find out if any of those values exist in another list (which could be in either a row or a column elsewhere). You can do that in Excel by using the MATCH function to test for a specific value in another range. We’ll look at that below. Worksheet setup First, let’s set up a worksheet example. You can replace with any values you like of course. Here’s a list we want to find duplicates from. Think of this as your ‘Test’ or source list. Red, Pink, Purple, Blue Here’s a list that we want to look into. Think of this as our ‘Master’ list. Red, Orange, Yellow, Green, Blue, Indigo, Violet…
Read More
How to change the case of your text in Excel

How to change the case of your text in Excel

100 level, Excel
[wp_ad_camp_1] [wp_ad_camp_4] Three functions to change the case of text in Excel You can easily change the case of text in Excel. Unfortunately, Excel doesn't support an in-place way of converting text from one case to another as you can do in Word, Excel's Office sibling. Out of the box, Excel provides a few worksheet functions that give you a basic level of conversion. But since they're functions, you can't change the text in place. You need to put the new value in another cell or use in another formula. Here are three text case conversion functions you can use. UPPER LOWER PROPER UPPER and LOWER do what you'd think. They convert to all upper or lower case text. PROPER will add an initial capital letter at the beginning of…
Read More

How you can use an add-in to make a quick-and-dirty sentiment analysis spreadsheet with Excel

400 level, Excel
[wp_ad_camp_1] [wp_ad_camp_4] Note: This post describes some capability you only get by installing an add-in for Excel. The add-on used here is fully functional and free during its trial period - so you'd have plenty of time to try this out. The add-in is called Excel PowerUps Premium Suite and using the steps below you can create a little sentiment analysis tool using a feed from the Twitter API. A link to download the free trial is at the bottom of the page. Note2: The Twitter API used as an example in this post has been retired. The new API requires authentication as well as only returning JSON instead of XML. I'll be looking at adding both of these to the pwrWEBSERVICE and pwrFETCHXMLVIAGET functions in the weeks to come. When…
Read More
How to add a drop down list in Excel to your worksheet

How to add a drop down list in Excel to your worksheet

100 level, Excel
[wp_ad_camp_1] [wp_ad_camp_4] Two ways to add a drop down list in Excel Sometimes you have a sheet that you need other people to fill in. And, you have a column or range of cells that need to have values from a specific set of values. You don't want to have to deal with multiple variations of "yes", for example. You might wind up with "Yes", "1", "True", "Y", "T", and who knows what else. You need people to stick to the menu of choices to make your analytic life much easier. The solution: add a drop down list in Excel. You've seen drop down pick lists in other people's spreadsheets and want to do the same in yours. The process is pretty straightforward. I'll describe a couple of common ways below. The…
Read More

How to refer to a cell in Excel and have that reference remain unchanged

100 level, Excel
[wp_ad_camp_1] [wp_ad_camp_4] Do you remember playing Battleship (the board game). You called out the coordinates for your shot using letters for the row labels, and numbers for the column labels. Excel is laid out the same way (just reversed). When you reference a cell you use its column and row coordinates. For example, A1 represents the cell in the first column ("A") and the first row ("1"). When you reference that cell such as below you are using a relative reference. =A1 This is called relative because if you copy that formula to another cell, the reference will adjust to be relative to the original reference. For example, if you copy the formula above to the cell immediately below the formula will be changed to the one below automatically. You…
Read More
Keep your row and column headings visible as you scroll in Excel

Keep your row and column headings visible as you scroll in Excel

100 level, Excel
[wp_ad_camp_1] [wp_ad_camp_4] How to freeze row and column headings in Excel It's pretty easy to get a large number of rows or columns in one of your spreadsheets. And often you wind up having to scroll up and down or side to side in order to keep track of which column or which row you are looking at. If you ever need to keep the row headings or the column headings "pinned" on the screen so that you can track your place easier you need to use the Split and Freeze Panes features in Excel. This will allow you to freeze row and column headings in Excel. PINNING THE COLUMN HEADINGS If you want to pin or lock in place your column headings Excel lets you do that with the…
Read More