How to Generate Random Demographic Data

How to Generate Random Demographic Data

300 level, Excel
[wp_ad_camp_1] [wp_ad_camp_4] How to Generate Random Demographic Data Why Generate Random Demographic Data? There are several reasons I can think of that you would want to or need to generate random demographic data. They primarily center on testing scenarios. Due to the nature of the data, it may be unfeasible for you to access real data to test your application or process. You wouldn’t want to risk exposing PII (Personally Identifiable Information) or other sensitive information. Also, some of the data you may need to test would be restricted or protected under the Sarbanes-Oxley Act (SOX) and/or the Health Insurance Portability and Accountability Act (HIPAA). There are complex regulations that you don’t want to run afoul of, but most of all you want to protect your customer’s sensitive data –…
Read More
Date Values in Excel Explained

Date Values in Excel Explained

100 level, Excel
Date values in Excel are numbers In Excel, a date is the number of days since January 1, 1900 starting with January 1, 1900 being “1”. Each date after that, Excel adds one more number to that sequence. So August 26, 2013 is 41512, or 41,512 days since January 1, 1900. The integer part of the number is used for the days. The decimal part of the number is the fractional part of the day -- or the time. So .5 would be 50% of the way thru the day, or 12:00 noon. That makes 41,512.5 to be equivalent to 12:00 noon on August 26, 2013. The date number pattern is a follows. DDDDD.TTTTTT So as you might imagine, adding 3 to the date value of August 30, 2013 results…
Read More
Percentage Change Between Two Numbers

Percentage Change Between Two Numbers

200 level, Excel
[wp_ad_camp_1] [wp_ad_camp_4] I was asked what the Excel function was for finding the percentage of change between two numbers in Excel. It turns out there is no dedicated function for that. That's OK. The formula for calculating the change between two numbers in Excel is really simple (and there is one less function in Excel that you'd need to learn). The formula for % change between two numbers The simple formula is shown below. =(A2/A1)-1 In this example, cell A2 contains the new number and cell A1 contains the original number. The formula will return a value that represents the percentage change between the two numbers. Negative changes will show up as negative numbers. If you want to see the value as a percentage, just click the percent sign button "%" in…
Read More

How to Open Excel Files in Separate Windows Automatically

400 level, Excel
  I was asked how set up Excel so that opening individual Excel files would open in separate Excel Windows. By default, it seems Excel 2007 and 2010 open separate files in the same instance of Excel. In technical terms, Excel uses MDI instead of SDI. I searched and found several posts that basically said "can't be done" or "not supported". I found some others that outlined some Registry tweaks. They were slightly different in their instructions and a little hard to follow. I tried some of the changes and have documented what has worked for me on multiple systems with different versions of Windows as well as Excel. Setting up your system to open Excel files in separate windows If you have Excel 2007 or Excel 2010, you can…
Read More
Calculator function equivalents in Excel

Calculator function equivalents in Excel

200 level, Excel
[wp_ad_camp_1] [wp_ad_camp_4] Excel calculator functions I took a look at a basic scientific calculator I had in a drawer and I thought it might be interesting to show how each of the buttons on the calculator would work in Excel. So below is my simple inventory of the scientific calculator functions and their equivalent functions in Excel. In the examples below, just assume that the value of “x” is in cell A1. Calculator function list Inverse function $latex x^{-1}$ Excel formula(s) Each of the formulas below achieves the same thing in Excel. =1/A1   =A1^-1 Trig functions $latex sin(x)$ $latex cos(x)$ $latex tan(x)$ $latex sin^{-1}(x)$ $latex cos^{-1}(x)$ $latex tan^{-1}(x)$ Excel formula(s) Each of the formulas below achieves the same thing in Excel as the corresponding calculator button above. =SIN(A1)  …
Read More
How to convert text to number values in Excel

How to convert text to number values in Excel

200 level, Excel
[wp_ad_camp_1] [wp_ad_camp_4] In Excel, if you have text that represents a number that is not recognized as a number value some Excel formulas may not work correctly. In order to convert a text number into a number value you have a few options. Convert text to number First, you can just multiply the value by 1. This will force the conversion of the text into a numerical value and return the equivalent numerical value. =A1*1 Next, you can use the VALUE formula. You wind up with the same result. =VALUE(A1) Convert Roman Numeral text to number If your text is a Roman Numeral you can convert that to an equivalent numerical value (in decimal). Excel 2013 introduces a function called ARABIC that will convert roman numerals into decimal value equivalents.…
Read More
How to get the formula of a cell in Excel

How to get the formula of a cell in Excel

200 level, Excel
[wp_ad_camp_1] [wp_ad_camp_4] How to get the formula in a cell To get the formula in a cell, the FORMULATEXT function was introduced in Excel 2013. It's as simple as the following. Just reference the cell with the formula you're interested in. =FORMULATEXT(A1) Need to do the same, but in older versions of Excel? If you need to get the formula in a cell in Excel 2003, 2007 or 2010 you can use the pwrFORMULATEXT function. pwrFORUMLATEXT is available in an Excel addin you can download from the link below. You use it the same way as the new function in 2013. =pwrFORMULATEXT(A1) Get the free addin Overall, there are about 50 new worksheet functions in Excel 2013. The addin linked below adds 46 of the 50 functions so your legacy version…
Read More
Create a trip calculator with Excel and web services

Create a trip calculator with Excel and web services

300 level, Excel
[wp_ad_camp_1] [wp_ad_camp_4] Using Excel, you can create a trip calculator that uses web services to provide dynamic information that is up to date. I created this post after reading a post with a similar theme from Glen Gilchrist. In the example below, you'll see that you can create the trip calculator using Excel functions and without needing to write any code. Note: The illustrations below will work with Excel versions 2003 - 2010 by installing the Excel PowerUps Premium Suite. If you have Excel 2013, you can create this trip calculator without the add-in -- just remove the "pwr" prefix from the function names in the examples below. Excel 2013 already has built in WEBSERVICE and FILTERXML functions! Here's the gist of how we'll put this together For the calculator,…
Read More

Print Column Headings on Every Page in Excel

100 level, Excel
Print column headings on every page in Excel so that every page printed has the labels at the top of the columns. This will save a bunch of flipping back and forth to keep track of what you are reading on subsequent pages. The few steps below are specifically for Excel 2010, but they’ll general apply to your version of Excel too. The key is to get to the Page Setup dialog box where you will specify which row contains your column headings. How to print column headings on every page in Excel 2010 In Excel 2010, go to the Page Layout tab and click Print Titles. This is in the Page Setup group on the ribbon. Go to the Sheet tab on the Page Setup dialog box. Here, you…
Read More
How to create a resource utilization chart in Excel

How to create a resource utilization chart in Excel

300 level, Excel
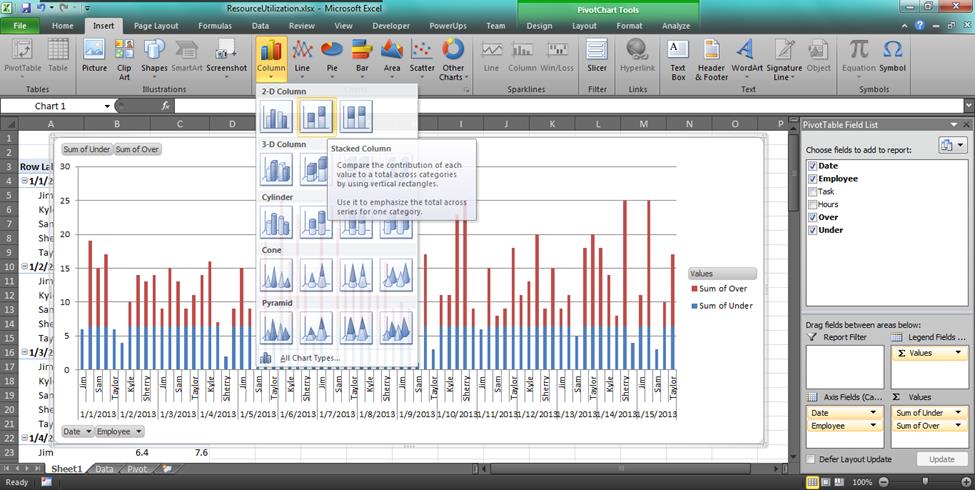
[wp_ad_camp_1] [wp_ad_camp_4] "Resource utilization charts" The name I use to refer to these charts is “resource utilization chart”. I use this name because that’s what I’ve come to know them as within Microsoft Project. They may have another, better suited name. If so feel free to note that in the comments below. Edit: Resource utilization histogram Going for a PMP certification? You'll need A Guide to the Project Management Body of Knowledge: PMBOK(R) Guide. Strategy for creating the resource utilization chart The general strategy here is to use a stacked column chart, and define a pair of calculated fields from the data that will actually be charted. I explain that more below, and use a scenario that may be similar to one of yours to help make it clear. So,…
Read More