How to Generate Random Demographic Data
Why Generate Random Demographic Data?
There are several reasons I can think of that you would want to or need to generate random demographic data. They primarily center on testing scenarios. Due to the nature of the data, it may be unfeasible for you to access real data to test your application or process. You wouldn’t want to risk exposing PII (Personally Identifiable Information) or other sensitive information.
Also, some of the data you may need to test would be restricted or protected under the Sarbanes-Oxley Act (SOX) and/or the Health Insurance Portability and Accountability Act (HIPAA). There are complex regulations that you don’t want to run afoul of, but most of all you want to protect your customer’s sensitive data – you’d want nothing less for your own data.
Other Benefits of Generating Random Demographic Data
You’re actual customer data set may be relatively small and generating your own data gives you the ability to massively scale up the amount of data you test with. This will help you more appropriately run performance and stress testing on your application.
Additionally, using realistic data values instead of “asdf…” everywhere will make it easier for your testers to spot inconsistencies and other unexpected data issues. Other tasks such as product demos can be more realistic with randomly generated data. You’ll have to leave less up to the imagination for your product owners or stakeholders.
Ok, you’re sold. Now generate some data!
In this illustration we’ll generate data for the following demographic data elements. You can extend this example to add any number of additional data types to suit your needs.
- First Name – These will either be male or female as designated.
- Last Name – Nothing special here. And no hyphenated names in this example.
- Full Name – We’ll make this show up as last name, first name.
- Gender – This will either male or female, obviously. We’ll also drive the generation of the First Name field with the Gender value.
- Date of Birth – A randomly generated date value.
- Age – This will be computed based on the Date of Birth and today’s date.
- City – One of several cities.
- State – One of several states.
- Zip – A random number that looks like a zip code. Note that the City, State Zip combination in this example is not limited to an actually valid City, State Zip combination.
- Phone Number – This will be a basic phone number pattern.
- Retirement Status – We’ll make this field return a value based on the person’s age and an arbitrary likelihood that a person of that age may be retired.
- Recent Medical Exam – We’ll make this field return a value based both on the person’s Retirement Status, Gender as well as an arbitrary likelihood that a retired person of a given gender would have had a Recent Medical Exam.
- Account Comments – Here we’ll just generate some random text to represent something being typed into a customer record.
Field-by-Field Setup
Next I’ll outline the formulas used for each of the fields to generate random demographic data. In addition to the standard Excel functions, the following functions from the Excel PowerUps Premium Suite (free download from this site) will be key to easily generating random demographic data.
- pwrMAYBE
- pwrRANDFROMRANGE
- pwrRANDFROMSET
- pwrRANDOMNAME
- pwrRANDOMTEXT
To kick this off, in Row number 1 create the following headings starting in Column A.
ID Number, First Name, Last Name, Full Name, Gender, DOB, Age, City, State, Zip, Phone Number, Retired, Recent Medical Exam, Account Comments
These should span from Column A thru Column N if we’re on the same page at this point.
Click anywhere in that first line of text fields you just entered.
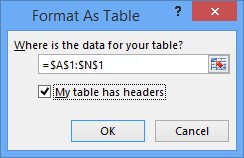
On the HOME tab, select Format as Table and select any of the table styles that shows up.
In the Format As Table dialog box, be sure that your range is set to “=$A$1:$N$1”. Also make sure the My table has headers checkbox is selected. Then click OK.
Now, we’ll move on to Row 2 and start putting the formulas into your worksheet. Each of the sections below will highlight what you need to enter in each cell with an explanation for each.
ID Number
We’ll insert an ID number field to simulate a customer record number. In cell A2, enter the following:
=ROW()
This will just use the row number as the customer ID number. Not that imaginative… I admit it.
Now, highlight cell A2 again and grab the fill handle (that heavy dot in the lower right corner of the cell) and drag it straight down several rows and let go. You’ll see the table grow by several rows and the first column will now have ID Numbers filled down to wherever you released.
First Name
To create the first name data we’ll use the pwrRbANDOMNAME function. These will either be male or female as designated by the data in column E (Gender). In cell B2, enter the following:
=pwrRANDOMNAME("first",[@Gender])
This will insert a random first name suited to the gender from the Gender column. You’ll see that the names in the column automatically fill down since this is a table in Excel. Don’t worry that the Gender column is blank at the moment – the pwrRANDOMNAME function is just using it’s default value of both genders.
Last Name
To create the last name data we’ll use the same pwrRANDOMNAME function, but with different parameters. There’s nothing really special here. And no hyphenated names in this example. In cell C2, enter the following:
=pwrRANDOMNAME("last")
Full Name
Here, we’ll just use the string concatenation operation (“&”) in Excel to create a “last name, first name” display. In cell D2, enter the following:
=[Last Name]&", "&[First Name]
Gender
This will either male or female, obviously. We’re also drive the generation of the First Name field with the Gender value. Since we only want to select between two values here (“male” or “female”) we’ll use the pwrRANDFROMSET function. This will select amongst a set of values provided in the function. In cell E2, enter the following:
=pwrRANDFROMSET("male", "female")
Date of Birth
Here’s we’ll randomly generate a date value between January 1, 1920 and today. The selection of 1920 is totally arbitrary in case you’re wondering. In cell F2, enter the following:
=RANDBETWEEN(DATEVALUE("1/1/1920"), TODAY())
This will produce a number representing a date between January 1, 1920 and today. In order to view the number value as a date you’ll also need to change the formatting of the column from Number to Date. You can do this by selecting Date from the drop-down list in the Number group up in the ribbon.
Age
This will be computed based on the Date of Birth and today’s date. In cell G2, enter the following:
=ROUNDDOWN(((TODAY()-[DOB])/365),0)
This is getting the number of days between today, and the Date of Birth (the DOB column). This value is divided by 365 (the number of days in a year). And the result is rounded down because that’s how we talk about our ages unless your five years old – then you get to add on “and a half” part way thru the year.
City
Here, as well as the State and Zip columns we’ll set up a data list elsewhere on the worksheet. This will represent the set of city names we wish to use while generating random demographic data. Outside of the table (starting in cell Q2) enter the following city names (in cells Q2 thru Q11).
- New York
- Los Angeles
- Chicago
- Houston
- Philadelphia
- Phoenix
- San Diego
- Dallas
- San Antonio
- Detroit
This will be our city data set from which we’ll randomly select names. As you can imagine, this list can be extremely long if you wish. We’ll use the pwrRANDFROMRANGE function to randomly select a city name from the range of names that we just put into Excel. In cell H2, enter the following:
=pwrRANDFROMRANGE($Q$2:$Q$11)
State
We’ll do the same process for State as we did for City. Again, outside of the table (starting in cell R2) enter the following State postal abbreviation codes (in cells R2 thru R11).
- AL
- AR
- CA
- DE
- GA
- HI
- KS
- LA
- MA
- MS
This will be the state data set from which we’ll randomly select state abbreviation codes. We’ll again use the pwrRANDFROMRANGE function to randomly select a state postal code from the range of values that we just put into Excel. In cell I2, enter the following:
=pwrRANDFROMRANGE($R$2:$R$11)
Zip
In this column, we’ll just create a random number that looks like a zip code. Note that the City, State Zip combination in this example is not limited to an actually valid City, State Zip combination. In cell J2, enter the following:
=RANDBETWEEN(10000,99999)
Phone Number
Similar to the zip code, we’ll just generate a number pattern that looks like a phone number. In cell K2, enter the following:
="("&RANDBETWEEN(100,999)&") "&RANDBETWEEN(100,999)&"-"&RANDBETWEEN(0,9999)
Retirement Status
We’ll make this field return a value based on the person’s age and an arbitrary likelihood that a person of that age may be retired. In this example we’ll use 65 as that age. And we’ll assert that there’s a 70% chance that a person will be retired when they turn 65. Here, we’ll need to use the pwrMAYBE function because in this example, a person *may* be retired if they’re 65, but not necessarily. And we’re assuming that before 65 nobody is retired in this example. Here’s what that looks like. In cell L2, enter the following:
=pwrMAYBE(IF([@Age]>=65,TRUE(),FALSE()),TRUE(),70)
If you read up on the pwrMAYBE function you’ll see that there’s an extra TRUE() value in the formula above. That’s because there are a minimum of two conditions that need to be present for the pwrMAYBE function. Since we’re only evaluating one (the age) we’re fixing the other condition at TRUE().
Recent Medical Exam
This is another totally arbitrary field. But here imagine we want to know whether a retired woman has had some medical examination – and that 80% of retired women have had the examination. We’ll use the same pwrMAYBE function to possibly indicate true, but not necessarily. In cell M2, enter the following:
=pwrMAYBE(IF([@Retired],TRUE(),FALSE()),IF([@Gender]="female",TRUE(),FALSE()),80)
Account Comments
In this column we’ll just use the pwrRANDOMTEXT function to generate a bunch of gibberish text. In cell N2, enter the following:
=pwrRANDOMTEXT(250)
This will insert up to 250 words of random gibberish text (Lorem Ipsum-based) into the cell.
At this point you have a table filled with random data. See, it wasn’t too hard to generate random demographic data for your application. You can adjust, tweak, extend or otherwise alter this in any way to suit your unique needs.
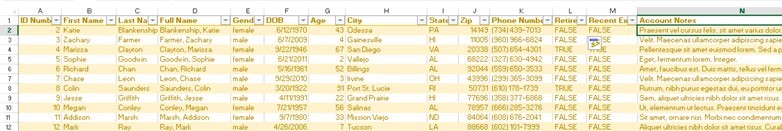
Up to this point we’ve just been aiming at generating a bunch of random data about people. If you need to create sample data for any other purpose hopefully you can see you can follow the same patterns used above and generate any sample data you need. Coming up with a bunch of fake data for your testing, demos, or other needs isn’t the most fun part of the overall task. But at least it can be done quickly with some degree of predictability – even though it’s all random.
Exporting the Data is Easy
Once you’ve set up the table to generate the data in Excel, getting this into your own application is very straightforward. Excel allows you to export the data in a number of formats including delimited text files (like CSV) or as XML files. You can use these to import into your database system such as SQL Server or Access.
There you go.