How to drag and drop columns in Excel

How to drag and drop columns in Excel

100 level, Excel
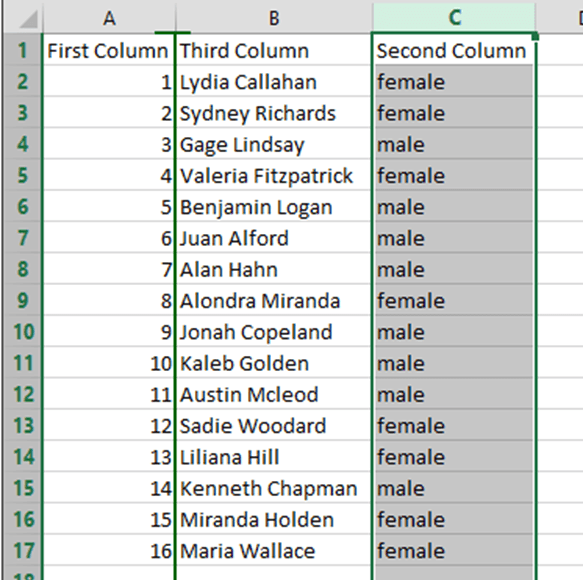
[wp_ad_camp_1] [wp_ad_camp_4] This is a quick little tip that makes it really easy to move columns of data around in Excel. It's basically a drag and drop operation - basically. In the example below, we'll just move the data in column C over to column B. When done, the column headings will be in order: First Column; Second Column; Third Column. [caption id="attachment_3350" align="alignnone" width="588"] Sample worksheet[/caption] First, select the entire column. To select a column, click the column heading (one of the letters or double-letters). Don't select a cell and try and highlight everything - just click the column heading. In this example, click the "C" so that we can move column C. [caption id="attachment_3351" align="alignnone" width="586"] Select the column to move[/caption] Next, hover your cursor over one of…
Read More
Excel moving average formula and explanation

Excel moving average formula and explanation

400 level, Excel
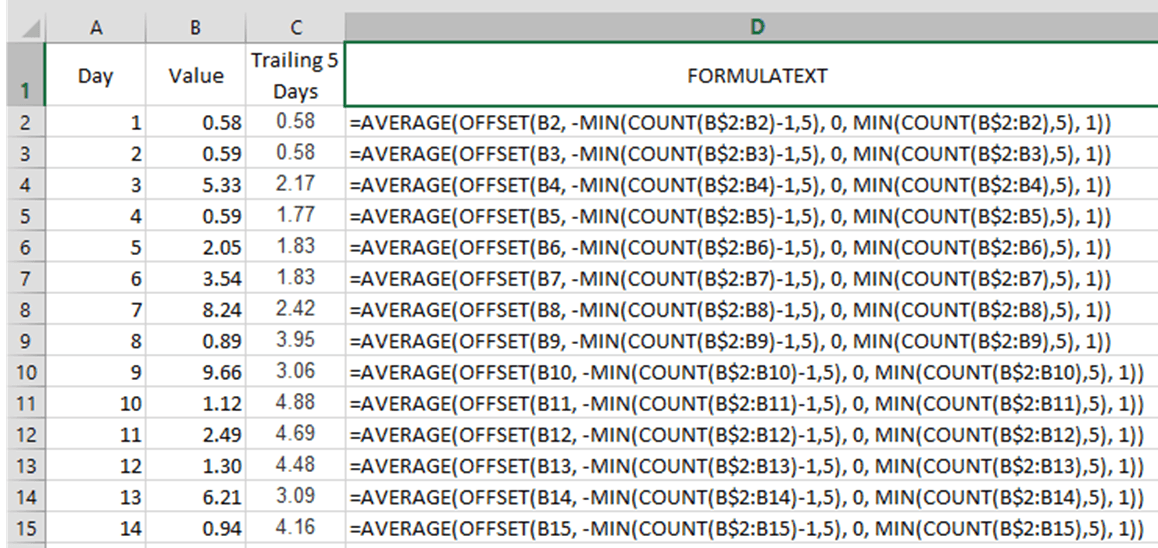
[wp_ad_camp_1] [wp_ad_camp_4] In the example below, an Excel moving average formula is set up. It averages the values from a trailing number of days. For the initial set of days, it averages the available days and becomes a trailing or moving average after the desired number of days have passed. You can also modify this to just show a 0 for the days leading up to the first set to be averaged. Excel moving average formula Here's the formula I used, for those that just want to grab and go. It's set up to calculate the 5-day moving average of the Value column. The figure below shows the worksheet used in this example. [codeblocks name="Moving average formula"] Put this formula in the first cell you want to begin the moving…
Read More
Excel CONTAINS function

Excel CONTAINS function

Excel
[wp_ad_camp_1] [wp_ad_camp_4] There isn't exactly an Excel CONTAINS function out of the box. However the Excel PowerUps add-in for Excel 2010, Excel 2013, and Excel 2007 provides a function called pwrCONTAINS that will return a simple TRUE or FALSE value based on whether the string your interested in is within another string. You could do this by testing and nesting a couple other Excel functions. However, this add-in makes the check really simple. Excel CONTAINS function: use pwrCONTAINS The pwrCONTAINS function documentation is on this page. As a simple example of an Excel CONTAINS function the formula may look like the following. =pwrCONTAINS("error", B4) This will return TRUE is cell B4 contains the word "error" in its text.
Read More
How to create a boxshot using Word

How to create a boxshot using Word

Word
[wp_ad_camp_1] [wp_ad_camp_4] You don't need to buy a graphics package or download an app to create a nice looking box shot. You can create a box shot like the one pictured below using only Microsoft Word. Step-by-step instructions on how I created the images below are below. Now you can see how to create a boxshot using Word. Boxshot Examples This method would work to create any number of boxes, jewel cases, or even book covers. The examples below show two wire frame versions of a box and of a jewel case. Below that is the more final version. [caption id="attachment_3258" align="aligncenter" width="421"] Sample boxshots created using Word.[/caption] [caption id="attachment_3234" align="aligncenter" width="175"] Sample wire frame boxshot created using Microsoft Word.[/caption] [caption id="attachment_3235" align="aligncenter" width="158"] Sample jewel case wire frame created…
Read More
How to calculate compound interest in Excel

How to calculate compound interest in Excel

200 level, Excel
[wp_ad_camp_1] [wp_ad_camp_4] Compound Interest Compound interest is interest added to the principal and interest earned in previous periods. This addition of interest to the principal is called compounding. Just below you can see how to calculate compound interest in Excel. The formula for calculating compound interest is =PV*(1+R)^N How to calculate compound interest in Excel The formula above is entered in Excel as =PV*(1+R)^N In the formula, PV is the present value. R is the interest rate. And N is the number of periods (such as annually) that you want to compound. Example Suppose you have $1000 to start with. Your present value (PV) would be 1000. If you expect to earn 7% annual interest, your rate (R) would be .07. To see how much you would have after 10…
Read More
How to compare two strings in Excel

How to compare two strings in Excel

200 level, Excel
[wp_ad_camp_1] [wp_ad_camp_4] How to Compare Two Strings in Excel for Similarity Excel comes loaded with several useful text or string comparison functions. Out of the box, Excel provides a function named EXACT that will return whether two strings are exact matches. That's great, unless you actually need to find strings that are really close or very similar. The good news is when you want to compare two strings in Excel you aren't limited to exact matches only. Using a function such as pwrSIMILARITY you can compare two strings and get a rating back (a percentage) that indicates the degree of similarity between the two strings. You actually have a great deal more flexibility with pwrSIMILARITY. For example, the EXACT function is case sensitive so comparing "Abc" and "abc" would return…
Read More
How to Generate Random Text in Excel

How to Generate Random Text in Excel

200 level, Excel
[wp_ad_camp_1] [wp_ad_camp_4] A Little About Lorem Ipsum "Lorem Ipsum" text is commonly used in the printing or design industry as dummy text used as a placeholder for "real" text. The Lorem Ipsum text is originally from Latin literature that is over 2,000 years old. It is not Latin-looking gibberish as often believed. Generate Random Text in Excel You can use the pwrRANDOMTEXT function in Excel to generate random text. The random text generated will be based on the Lorem Ipsum text commonly used as filler. This function is available as part of the Random Data Assistant contained in the Excel PowerUps Premium Suite add-in for Excel. In order to use this function you simply use it in your worksheet as you would any other function. Examples If you want to…
Read More
How to Hide Gridlines in Excel

How to Hide Gridlines in Excel

100 level, Excel
[wp_ad_camp_1] [wp_ad_camp_4] I've got this question several times. How do you hide the gridlines in Excel? It's a really quick task as you can see below. For each of Excel 2013, Excel 2010, and Excel 2007 you can click the View tab in the Ribbon. In the Show group, uncheck the Gridlines checkbox. Now you know how to hide gridlines in Excel. To show gridlines in Excel, just check the Gridlines box. There you go.
Read More
Return Random Value from List in Excel

Return Random Value from List in Excel

200 level, Excel
[wp_ad_camp_1] [wp_ad_camp_4] Two Functions to Make Returning Random Data Easy Using the pwrRANDFROMSET and pwrRANDFROMRANGE functions it's easy to get a random value back to your formula. Random Values from a Set The pwrRANDFROMSET function returns a value from a set defined within the function while the pwrRANDFROMRANGE function returns a value from a defined range in Excel. If you wanted to return a random value from a set of colors you can use the equation below as an example. =pwrRANDFROMSET("red", "pink", "green", "blue", "black", "orange", "yellow") This will return a random value from the set of colors in the formula. Random Values from a Range The pwrRANDFROMRANGE function returns a value from a range of cells. This range can be multiple columns and rows as long as they are…
Read More
How to Collect Excel User Input and Return to Formulas

How to Collect Excel User Input and Return to Formulas

300 level, Excel
[wp_ad_camp_1] [wp_ad_camp_4] Collecting Excel User Input Using the Excel PowerUps Premium Suite you can easily collect basic user input and return that input to your formula. You can use the function called pwrINPUTBOX to prompt the user to provide some information. Since this is a function made available to you in Excel, you don't need to write any code. Example Here's an example. Imagine you need to have the user provide some information if a value is beyond a given threshold. Let's say if a key performance metric falls below a specific level you want to capture a brief note regarding why from the user. So let's say we want to capture an explanation if the KPI falls below 85%, and that the KPI is in cell A1. The formula…
Read More