Print Column Headings on Every Page in Excel

100 level, Excel
Print column headings on every page in Excel so that every page printed has the labels at the top of the columns. This will save a bunch of flipping back and forth to keep track of what you are reading on subsequent pages. The few steps below are specifically for Excel 2010, but they’ll general apply to your version of Excel too. The key is to get to the Page Setup dialog box where you will specify which row contains your column headings. How to print column headings on every page in Excel 2010 In Excel 2010, go to the Page Layout tab and click Print Titles. This is in the Page Setup group on the ribbon. Go to the Sheet tab on the Page Setup dialog box. Here, you…
Read More
TFS Daily Emails

TFS Daily Emails

PowerShell
[wp_ad_camp_1] [wp_ad_camp_4] TFS Daily Emails: How to get regular TFS query results into your inbox automatically Team Foundation Server (TFS) allows you to create queries and save them as personal views or team views. You can even set up alerts on individual work items assigned to you so you know when they’re created or changed. However, TFS doesn’t give you a way to get a recurring snapshot of the TFS view you created into your inbox automatically. Sometimes waiting for a change event isn't what you're looking for. I’ve used the process outlined below for TFS daily emails and it’s been working great for me. I’m using a combination of the following: PowerShellTFS 2010Outlook 2010Task Scheduler You may not have the exact same versions as I’m working with, but the…
Read More
Display icons in SharePoint lists

Display icons in SharePoint lists

SharePoint
[wp_ad_camp_1] [wp_ad_camp_4] How to display status icons in a SharePoint list I needed to display a KPI indicator icon in one of my SharePoint list columns. To display status icons in SharePoint lists in my case, I needed to show a Red/Yellow/Green status symbol. I couldn’t find a setting in SharePoint that made this easy as I had done in Excel and Project before. But then a colleague showed me a little trick that scratched the itch just fine. The setup You’ll need to have a field that carries a value that the user can set. In my case, I created a field called “Status” and made it a drop-down select list with the values “Red”, “Yellow”, and “Green”. Next, I created a calculated field I called “Status Indicator”. The…
Read More
How to create a resource utilization chart in Excel

How to create a resource utilization chart in Excel

300 level, Excel
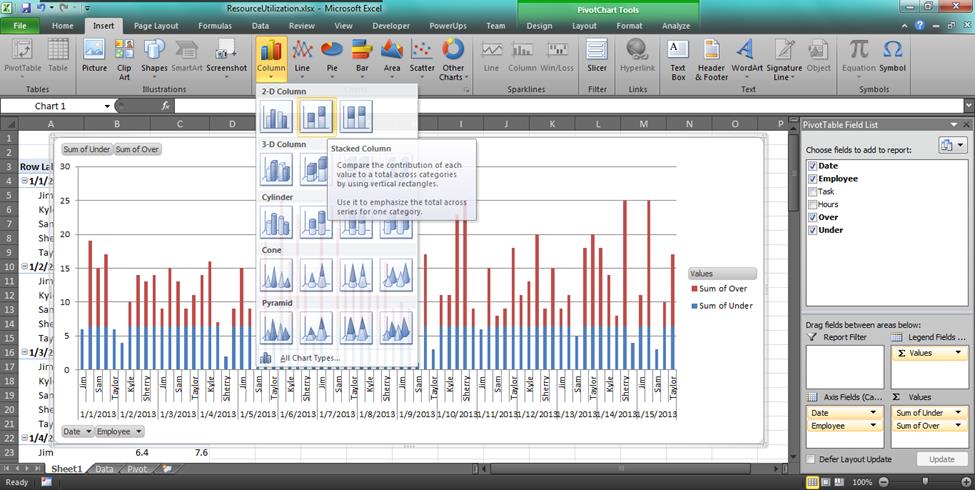
[wp_ad_camp_1] [wp_ad_camp_4] "Resource utilization charts" The name I use to refer to these charts is “resource utilization chart”. I use this name because that’s what I’ve come to know them as within Microsoft Project. They may have another, better suited name. If so feel free to note that in the comments below. Edit: Resource utilization histogram Going for a PMP certification? You'll need A Guide to the Project Management Body of Knowledge: PMBOK(R) Guide. Strategy for creating the resource utilization chart The general strategy here is to use a stacked column chart, and define a pair of calculated fields from the data that will actually be charted. I explain that more below, and use a scenario that may be similar to one of yours to help make it clear. So,…
Read More
Seamlessly install and deploy your Excel XLL add-in

Seamlessly install and deploy your Excel XLL add-in

Development, Excel, Utilities
[wp_ad_camp_1] [wp_ad_camp_4] Automatically install Excel Add-In Once you've created your Excel add-in you'll want to get it installed on your customer's instances of Excel, right? Excel add-in deployment can easily be automated using the Excel Add In Automatic Installer. As the name suggests, you can automatically install Excel add in XLLs and XLAs with this setup extension. Excel add-in deployment There are many web pages that give an overview of the steps that would need to get automated for an Excel add-in deployment - so it's doable. I spent a bunch of time culling through the advice that worked, and the advice that didn't work so well for my own Excel add-in deployment tool. I've repackaged that work into a utility that can help make your add-in get installed seamlessly. Save…
Read More
Fuzzy search in Excel to find similar text values in Excel

Fuzzy search in Excel to find similar text values in Excel

300 level, Excel
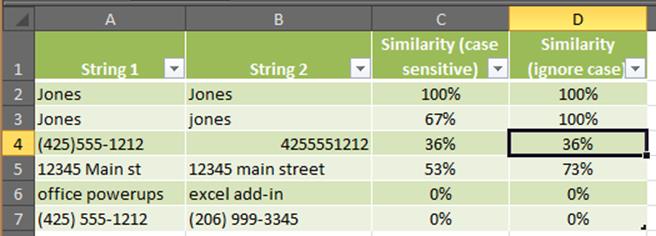
[wp_ad_camp_1] [wp_ad_camp_4] Sometimes you have a need to compare text strings that don't exactly match. You might need to match "(425)555-1212" to "4255551212" for example. Or perhaps you'd like to match "12345 Main st" to "12345 main street". The Excel PowerUps Premium Suite add-in (available as a free trial download) includes a function that helps you do just that by enabling a fuzzy search in Excel. Fuzzy Search and Replace If you want to do a fuzzy search and replace you can use the Fuzzy Find and Replace tool. You can see an example of it's use here. Fuzzy Search in Excel with a New Function for your Formulas The function is called pwrSIMILARITY. It simply compares the two text strings and returns a percentage value that represents how similar the…
Read More
How to generate a random date between two dates

How to generate a random date between two dates

300 level, Excel
How do you generate a random date between two dates? I was asked how to generate a set of random dates between two dates. At first glance, it didn't look like Excel had a function that would easily allow that. However, it turns out that using the RANDBETWEEN function is perfectly suited for this. Sample formula You will use the DATE function to specify your start and end dates for the range. Let's say you want to generate a date between January 1, 2013 and December 31, 2013. The function would look like the following. =RANDBETWEEN(DATE(2013,1,1),DATE(2013,12,31)) How does this work? This works because the DATE function returns a number that represents the date value in Excel. Then RANDBETWEEN generates a random number between those two date values (or numbers). The…
Read More