How to create a resource utilization chart in Excel
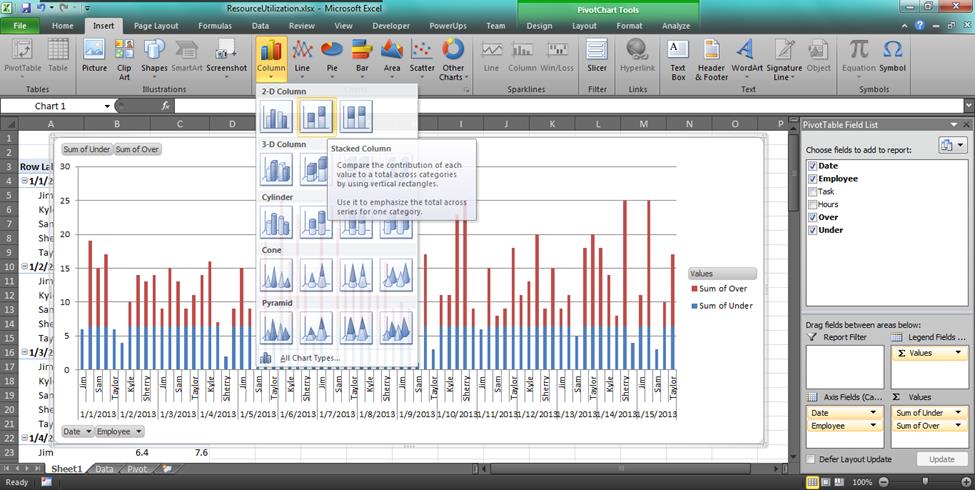
[wp_ad_camp_1] [wp_ad_camp_4] "Resource utilization charts" The name I use to refer to these charts is “resource utilization chart”. I use this name because that’s what I’ve come to know them as within Microsoft Project. They may have another, better suited name. If so feel free to note that in the comments below. Edit: Resource utilization histogram Going for a PMP certification? You'll need A Guide to the Project Management Body of Knowledge: PMBOK(R) Guide. Strategy for creating the resource utilization chart The general strategy here is to use a stacked column chart, and define a pair of calculated fields from the data that will actually be charted. I explain that more below, and use a scenario that may be similar to one of yours to help make it clear. So,…