Blog

How to locate the last cell of your worksheet

100 level, Excel
You might find that you’re worksheet prints a bunch of extra pages for no reason, or you wind up with an Out of Memory error message, or you may have an abnormally large file or other weirdness. This might just be because there is some information or formatting in a distant cell that you no longer need or was accidentally set. To find that last cell to take a look press the following keys together. CTRL SHIFT END If you find unneeded info or formatting in that cell, or you wind up way beyond that end of the data you’re using you can clear out the excess rows or columns to make Excel consider your worksheet smaller. To find out how, see how to clear unwanted rows or columns. There…
Read More

How to reset or clear the last cell in Excel to make your worksheet smaller

100 level, Excel
[wp_ad_camp_1] [wp_ad_camp_4] If you find yourself needing to clear out a bunch of unwanted rows and/or columns in Excel you can do that pretty quickly with the following 2-phase approach. Phase 1, clear unwanted columns Highlight the first of the columns that you want to clear out. This will be the first one to the right of the edge of the data you care about. Highlight the column by clicking on the column header (the letter name of the column). Press the following keys together. This will highlight the entire remaining right side of your worksheet. CTRL SHIFT RIGHT-ARROW Now click Clear All. You'll find this option on the Home tab on the ribbon, in the Editing group, in the Clear item drop down list. Phase 2, clear unwanted rows…
Read More
How to get more out of Excel’s Auto Fill feature

How to get more out of Excel’s Auto Fill feature

100 level, Excel
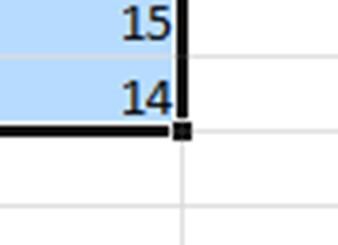
Quick basics Excel has a feature called Auto Fill that lets you start a series and then Excel can automatically fill in the rest of the cells by either repeating the series, or incrementing or decrementing some value. If you haven’t used it before, it can save a bunch of time with your data entry. To use the feature just highlight a bunch of cells, grab the fill handle, and drag your selection to more cells. The fill handle is that heavy dot that shows up in the lower right-hand corner of your selection. Getting more Excel has a number of Auto Fill options available, depending on the type of data you have in your selection. The options are listed below. Copy CellsFill SeriesFill Formatting OnlyFill Without FormattingFill DaysFill WeekdaysFill…
Read More
How you can add the 50 New Functions in Excel 2013 to your old copy of Excel

How you can add the 50 New Functions in Excel 2013 to your old copy of Excel

200 level, Excel
[wp_ad_camp_1] [wp_ad_camp_4] Excel add-in to power up older versions of Excel Excel 2013 has been released and it looks like there are about 50 new worksheet functions added. Now you can get a matching function for each of the new Excel 2013 functions that has the same name and same parameters. [table id=3 /] Excel 2013 new functions available for your old version of Excel The listing below shows the Excel 2013 new function that is available for Excel 2010, 2007 and 2003. The matching Excel PowerUps function is in parentheses after the name and can be used within Excel 2013 as well. You'll notice that each of the PowerUp functions has a prefix of "pwr". This is done to avoid name collisions with other functions you may have. All…
Read More
How to determine whether a given year is a leap year

How to determine whether a given year is a leap year

300 level, Excel
Identify a leap year in Excel: We all know what a leap year is. Every 4 years (almost) we get a February 29th. The ‘almost’ is the key thing. There are some conditions (none of which most of us will see in our lifetimes) where a leap year may get skipped. Here’s the algorithm for the determination that I found on Wikipedia. You can also read up on the history and such of the leap year there as well if you like. If the Year is divisible by 400, it IS a leap year.Otherwise if the year is divisible by 100, it’s NOT a leap year.If none of the above, and the year is divisible by 4, it IS a leap year.Otherwise it is just NOT a leap year. How…
Read More
How to find the number of months between two dates in Excel

How to find the number of months between two dates in Excel

300 level, Excel
[wp_ad_camp_1] [wp_ad_camp_4] Number of Months Between Two Dates? How many months are between two dates? The answer is “it depends” because your real question might be one of the following: How many months are between two days where the number is expressed as a fractional number?How many months are between two days where we’re only counting whole months?How many months are between two days rounding half months up to the nearest whole month?How many months are between two days where a fractional month counts as a whole month?How many months are between two days where days in any given month count as a whole month?As we’ll see below, the answer to each of the questions is different. And in your case, the specific question you’re really asking may be one…
Read More
An Excel function to calculate your dog’s or cat’s age

An Excel function to calculate your dog’s or cat’s age

400 level, Excel
[wp_ad_camp_1] [wp_ad_camp_4] Dog years, explained Do you think one person year equals seven dog years. I did, until doing some research. I wanted to add a “fun” conversion factor for a conversion function in an Excel add-in I've created. What I learned is that the seven year equivalent value is a pretty poor approximation of a dog’s equivalent age. Dogs do mature more quickly than people, but when they are young they mature at an even faster rate (relative to people) than they do when they are older. This post describes some capability you only get by installing an add-in for Excel. The add-in used here is fully functional and free during its trial period - so you'd have plenty of time to try this out. The add-in is called PowerUps…
Read More

Open xlsx files in Excel 2003

100 level, Excel
Do you still have Excel 2003, but somebody sent you a file from Excel 2007 or later? Need to open xlsx files in Excel 2003? Good news, you're not stuck - you're in luck. You can open xlsx files in Excel 2003 To open xlsx files in Excel 2003, Microsoft has an upgrade package called the Office Compatibility Pack that lets you open files in later versions of the Office apps. That's cool, because it saves you from having to upgrade the copy of Excel you have just to work with the new file formats. One thing you don't get is the new functions that might be used in the newer files. These would be worksheet functions that were added as part of the newer version of Excel. Here's a…
Read More
How to turn on the Developer tab in Excel

How to turn on the Developer tab in Excel

100 level, Excel
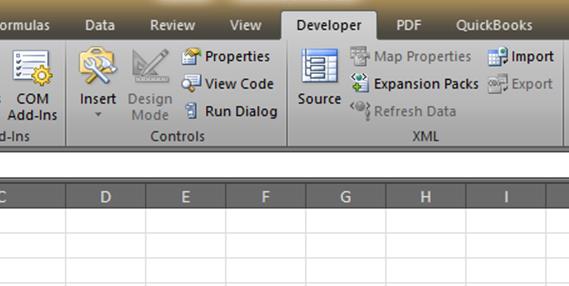
By now I'm guessing you've read some instructions that have asked you to click the Developer tab in Excel. But, you don't see it right? You need to turn on the Developer tab in Excel. Here are the few simple steps to enable the tab. There are steps for both Excel 2007 and 2010. Microsoft moved the option around a bit between versions. Steps to turn on the developer tab in Excel 2007 Click the Office Start button, then click Excel Options. Click on the Popular section in the left navigation, and then click the checkbox for Show Developer tab in the Ribbon. Click OK. The above will show the developer tab in Excel 2007 for you. Steps to turn on the developer tab in Excel 2010 Click File, then…
Read More

How you can use the Histogram tool in Excel

400 level, Excel
[wp_ad_camp_1] [wp_ad_camp_4] First off, what's a histogram? A histogram is just a chart that shows counts of items in discrete buckets. In other words, a bar chart. The histogram tool in Excel lets you define the groupings or buckets. Or, in the terms of the histogram you get to define the Bins. A standard bar chart in Excel will just chart the individual distinct values, which is often not what you need to do. Using the histogram tool you can have Excel automatically count the items in the various Bins you define, and then chart those. Note: You may have also heard of a Pareto chart. That's just a histogram sorted from highest count to lowest. Here's an illustration to highlight the difference Imagine you're a teacher and you need…
Read More