Excel moving average formula and explanation

Excel moving average formula and explanation

400 level, Excel
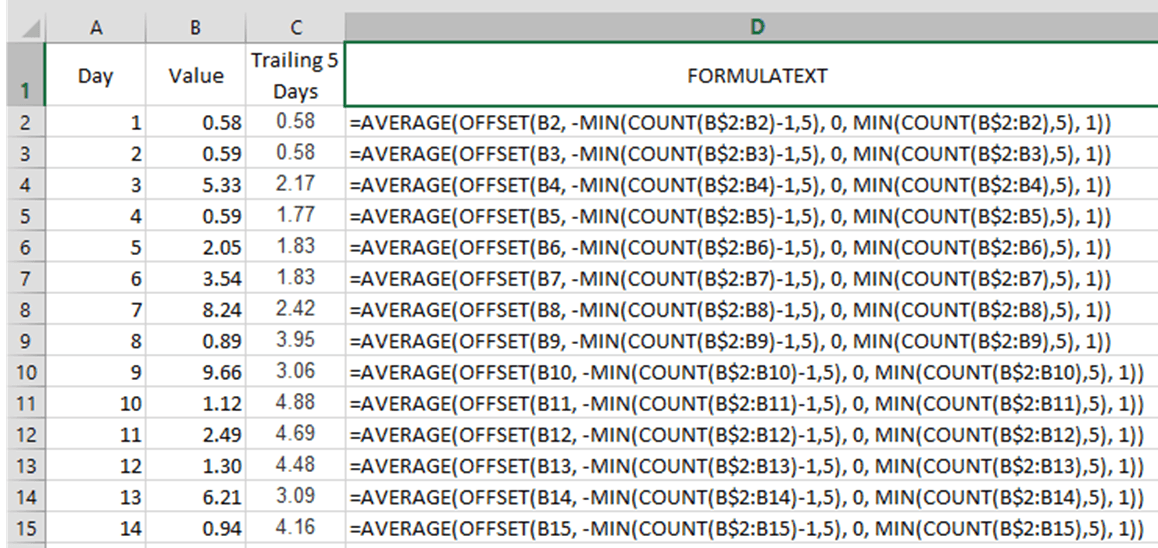
[wp_ad_camp_1] [wp_ad_camp_4] In the example below, an Excel moving average formula is set up. It averages the values from a trailing number of days. For the initial set of days, it averages the available days and becomes a trailing or moving average after the desired number of days have passed. You can also modify this to just show a 0 for the days leading up to the first set to be averaged. Excel moving average formula Here's the formula I used, for those that just want to grab and go. It's set up to calculate the 5-day moving average of the Value column. The figure below shows the worksheet used in this example. [codeblocks name="Moving average formula"] Put this formula in the first cell you want to begin the moving…
Read More
How to Bulk Import to SharePoint from Excel with a Choice Field

How to Bulk Import to SharePoint from Excel with a Choice Field

400 level, Excel, SharePoint, SharePoint Designer, Workflow
[wp_ad_camp_1] [wp_ad_camp_4] Scenario: Import to SharePoint from Excel Do you have a large SharePoint list with dozens, hundreds, or even thousands of items? And, are some of the columns in your list choice fields based on lookup values from other SharePoint lists? If you have data from an Excel file that you need to import to SharePoint from Excel, you’ll quickly find that a straightforward copy and paste operation won’t cut it. However, with a bit of prep work you can absolutely do a bulk import of your data without having to write code, or buy a special add-in. Setting up for the Import You will need to do a bit of prep work before you can do the actual import. But this setup work is trivial compared to trying…
Read More

How to Open Excel Files in Separate Windows Automatically

400 level, Excel
  I was asked how set up Excel so that opening individual Excel files would open in separate Excel Windows. By default, it seems Excel 2007 and 2010 open separate files in the same instance of Excel. In technical terms, Excel uses MDI instead of SDI. I searched and found several posts that basically said "can't be done" or "not supported". I found some others that outlined some Registry tweaks. They were slightly different in their instructions and a little hard to follow. I tried some of the changes and have documented what has worked for me on multiple systems with different versions of Windows as well as Excel. Setting up your system to open Excel files in separate windows If you have Excel 2007 or Excel 2010, you can…
Read More
An Excel function to calculate your dog’s or cat’s age

An Excel function to calculate your dog’s or cat’s age

400 level, Excel
[wp_ad_camp_1] [wp_ad_camp_4] Dog years, explained Do you think one person year equals seven dog years. I did, until doing some research. I wanted to add a “fun” conversion factor for a conversion function in an Excel add-in I've created. What I learned is that the seven year equivalent value is a pretty poor approximation of a dog’s equivalent age. Dogs do mature more quickly than people, but when they are young they mature at an even faster rate (relative to people) than they do when they are older. This post describes some capability you only get by installing an add-in for Excel. The add-in used here is fully functional and free during its trial period - so you'd have plenty of time to try this out. The add-in is called PowerUps…
Read More

How you can use the Histogram tool in Excel

400 level, Excel
[wp_ad_camp_1] [wp_ad_camp_4] First off, what's a histogram? A histogram is just a chart that shows counts of items in discrete buckets. In other words, a bar chart. The histogram tool in Excel lets you define the groupings or buckets. Or, in the terms of the histogram you get to define the Bins. A standard bar chart in Excel will just chart the individual distinct values, which is often not what you need to do. Using the histogram tool you can have Excel automatically count the items in the various Bins you define, and then chart those. Note: You may have also heard of a Pareto chart. That's just a histogram sorted from highest count to lowest. Here's an illustration to highlight the difference Imagine you're a teacher and you need…
Read More

How you can use an add-in to make a quick-and-dirty sentiment analysis spreadsheet with Excel

400 level, Excel
[wp_ad_camp_1] [wp_ad_camp_4] Note: This post describes some capability you only get by installing an add-in for Excel. The add-on used here is fully functional and free during its trial period - so you'd have plenty of time to try this out. The add-in is called Excel PowerUps Premium Suite and using the steps below you can create a little sentiment analysis tool using a feed from the Twitter API. A link to download the free trial is at the bottom of the page. Note2: The Twitter API used as an example in this post has been retired. The new API requires authentication as well as only returning JSON instead of XML. I'll be looking at adding both of these to the pwrWEBSERVICE and pwrFETCHXMLVIAGET functions in the weeks to come. When…
Read More